MLB predictions Sat, Oct 24
Win probabilities, projected runs and totals for every MLB game, plus batter and pitcher projections. Methodology →
1 game on this slate · model went 1–0 · 31–20 last 30 days →
Games
 Rays
 Brewers
Set at line MIL 52.2% · model 52.8%
Player props
Batters
| Hitting | Discipline | Running | ||||||
|---|---|---|---|---|---|---|---|---|
| Player | ||||||||
|
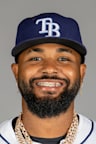
Junior Caminero
|
0.21 | 0.89 | 1.69 | 0.53 | 0.37 | 0.01 | 1.09 | 0.04 |
|
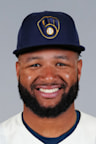
Jackson Chourio
|
0.18 | 0.90 | 1.60 | 0.42 | 0.24 | 0.01 | 1.10 | 0.09 |
|
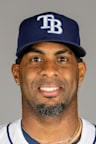
Yandy Díaz
|
0.13 | 1.03 | 1.60 | 0.38 | 0.31 | 0.04 | 0.94 | 0.01 |
|
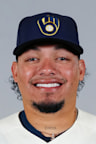
William Contreras
|
0.14 | 0.94 | 1.53 | 0.46 | 0.29 | 0.03 | 0.63 | 0.03 |
|
Jake Bauers
|
0.17 | 0.73 | 1.39 | 0.40 | 0.50 | 0.03 | 1.38 | 0.09 |
|
Jonathan Aranda
|
0.15 | 0.79 | 1.38 | 0.37 | 0.41 | 0.05 | 1.43 | 0.01 |
|
Brice Turang
|
0.11 | 0.75 | 1.27 | 0.33 | 0.46 | 0.01 | 1.21 | 0.13 |
|
Liam Hicks
|
0.11 | 0.76 | 1.25 | 0.38 | 0.33 | 0.05 | 0.72 | 0.01 |
|
Jonny Deluca
|
0.09 | 0.76 | 1.25 | 0.36 | 0.16 | 0.02 | 1.10 | 0.12 |
|
Victor Mesa
|
0.14 | 0.66 | 1.24 | 0.39 | 0.27 | 0.02 | 1.01 | 0.02 |
|
Richie Palacios
|
0.12 | 0.73 | 1.23 | 0.39 | 0.37 | 0.04 | 1.00 | 0.10 |
|
Cooper Pratt
|
0.10 | 0.77 | 1.21 | 0.38 | 0.26 | 0.03 | 0.74 | – |
|
Garrett Mitchell
|
0.12 | 0.70 | 1.20 | 0.38 | 0.35 | 0.03 | 1.43 | 0.13 |
|
Christian Yelich
|
0.12 | 0.71 | 1.18 | 0.36 | 0.27 | 0.02 | 1.16 | 0.07 |
|
Luis Lara
|
0.09 | 0.72 | 1.17 | 0.36 | 0.23 | 0.02 | 0.88 | – |
|
Chandler Simpson
|
0.01 | 0.92 | 1.13 | 0.29 | 0.18 | 0.00 | 0.56 | 0.21 |
|
David Hamilton
|
0.06 | 0.62 | 0.94 | 0.27 | 0.18 | 0.02 | 0.93 | 0.17 |
|
Taylor Walls
|
0.05 | 0.56 | 0.86 | 0.26 | 0.32 | 0.01 | 1.06 | 0.12 |
Pitchers
| Workload | Results | |||||||
|---|---|---|---|---|---|---|---|---|
| Player | ||||||||
|
Drew Rasmussen
|
100% | 5.5 | 22.6 | 6.1 | 1.66 | 4.51 | 0.12 | 2.10 |
|
Logan Henderson
|
100% | 5.6 | 22.3 | 5.9 | 1.41 | 4.21 | 0.11 | 1.78 |
|
Ian Seymour
|
80% | 0.9 | 3.7 | 1.2 | 0.30 | 0.74 | 0.02 | 0.38 |
|
Garrett Cleavinger
|
3% | 0.8 | 3.8 | 1.2 | 0.59 | 0.81 | 0.03 | 0.44 |
|
Griffin Jax
|
11% | 0.9 | 3.9 | 1.1 | 0.35 | 0.83 | 0.01 | 0.45 |
|
Aaron Ashby
|
33% | 0.9 | 4.2 | 1.1 | 0.44 | 0.86 | 0.05 | 0.51 |
|
Bryan Baker
|
31% | 0.9 | 4.0 | 1.0 | 0.44 | 0.70 | 0.01 | 0.35 |
|
Tyler Wells
|
50% | 0.9 | 3.8 | 1.0 | 0.34 | 0.72 | 0.02 | 0.44 |
|
Kevin Kelly
|
40% | 0.9 | 3.8 | 1.0 | 0.26 | 0.78 | 0.02 | 0.41 |
|
Kyle Harrison
|
35% | 0.9 | 4.0 | 1.0 | 0.32 | 0.91 | 0.06 | 0.47 |
|
Cole Sulser
|
34% | 0.9 | 3.9 | 1.0 | 0.38 | 0.73 | 0.02 | 0.39 |
|
Abner Uribe
|
37% | 0.9 | 3.8 | 1.0 | 0.36 | 0.75 | 0.02 | 0.37 |
|
Cam Booser
|
85% | 0.8 | 3.3 | 0.9 | 0.32 | 0.61 | 0.02 | 0.40 |
|
Trevor Megill
|
39% | 1.0 | 4.0 | 0.9 | 0.27 | 0.83 | 0.02 | 0.43 |
|
Freddy Peralta
|
8% | 0.9 | 4.2 | 0.9 | 0.52 | 0.87 | 0.01 | 0.52 |
|
Dl Hall
|
74% | 0.9 | 3.8 | 0.9 | 0.48 | 0.70 | 0.03 | 0.45 |
|
Shane Drohan
|
16% | 0.9 | 4.1 | 0.8 | 0.45 | 0.90 | 0.04 | 0.52 |
|
Steven Matz
|
17% | 0.9 | 4.0 | 0.8 | 0.40 | 0.83 | 0.03 | 0.42 |
|
Jojo Romero
|
73% | 0.9 | 3.7 | 0.8 | 0.33 | 0.73 | 0.05 | 0.37 |
|
Dustin May
|
12% | 0.9 | 3.9 | 0.7 | 0.42 | 0.77 | 0.03 | 0.48 |
|
Antonio Senzatela
|
71% | 0.9 | 3.9 | 0.6 | 0.35 | 0.98 | 0.03 | 0.56 |
No MLB props for this team at this position.
Pitching lines assume the pitcher appears; App is the chance of appearing. Each number is the model's average projection for that player, not a betting line.
Game conditions
| 1B | 2B | HR | BB | K | |
|---|---|---|---|---|---|
| Park | -8% | -5% | +8% | +3% | +9% |
| Weather | 0% | 0% | -1% | -1% | +1% |
| Umpire | 0% | 0% | |||
| Home field (MIL batting) | 0% | +3% | +4% | +4% | -4% |
How much each one raises or lowers that outcome. 0% is no change; blank means the model doesn't adjust that outcome for it.
Matchup
|
TB |
MIL |
League | |
|---|---|---|---|
| Hitters | |||
| Lineup | Confirmed | Projected | |
| K% | 17.3% | 22.8% | 22.5% |
| BB% | 8.5% | 9.8% | 8.1% |
| HR% | 2.5% | 2.6% | 3.1% |
| Starting pitcher | |||
| Starter | D. Rasmussen | L. Henderson | |
| K% | 24.4% | 29.7% | 22.5% |
| BB% | 5.0% | 5.7% | 8.1% |
| HR% | 3.0% | 3.5% | 3.1% |
| Innings | 5.6 | 5.6 | |
| Catcher & defense: effect on opposing hitters | |||
| K% | -2% | +2% | |
| BB% | +2% | -2% | |
Each team's own rates per plate appearance against an average opponent; the simulation combines the two sides. Innings is how long the starter is expected to last. League is the 2023-25 average.
Recommended bet
- Final
- Rays 4, Brewers 5
- Result
- MIL won by 1
- Why
- Model 52.8%, first price 52.2%
- Final
- Rays 4, Brewers 5
- Result
- TB lost by 1, needed to win by 2+
- Why
- Model 35.5% to cover, first line 33.9%: the favorite
Model vs market
- Model
- 36.0%
- First line
- 33.9%
- Latest
- 33.9%
Chance to cover. TB -1.5 +182 / MIL +1.5 -223 (vig removed)
- Model
- 52.1%
- First line
- 52.2%
- Latest
- 52.3%
Moneyline MIL -116 / TB +104 (vig removed) · opened 52.2%
- Model
- 7.5
- First line
- 6.5
- Latest
- 6.5
Over -108 / Under -111
Movement
Market is the no-vig moneyline at each of 2 captures, first 52.2%.
- First line
- DraftKings · Sat 10:47 AM ET
- Latest
- Closing line · DraftKings · Sat 7:41 PM ET · spread from Sat 10:47 AM
Against closing lines in past seasons, these models showed no edge. Record against the line →
Players
HR watch
- Junior Caminero0.21 HR
- Jackson Chourio0.18 HR
- Jake Bauers0.17 HR
- Jonathan Aranda0.15 HR
- William Contreras0.14 HR
Batters
|
TB @ MIL | 0.21 | 0.89 | 1.69 | 0.53 | 0.37 | 0.04 | 0.01 | 1.09 |

|
TB @ MIL | 0.17 | 0.73 | 1.39 | 0.40 | 0.50 | 0.09 | 0.03 | 1.38 |

|
TB @ MIL | 0.15 | 0.79 | 1.38 | 0.37 | 0.41 | 0.01 | 0.05 | 1.43 |
|
TB @ MIL | 0.18 | 0.90 | 1.60 | 0.42 | 0.24 | 0.09 | 0.01 | 1.10 |
|
TB @ MIL | 0.13 | 1.03 | 1.60 | 0.38 | 0.31 | 0.01 | 0.04 | 0.94 |

|
TB @ MIL | 0.12 | 0.70 | 1.20 | 0.38 | 0.35 | 0.13 | 0.03 | 1.43 |

|
TB @ MIL | 0.11 | 0.75 | 1.27 | 0.33 | 0.46 | 0.13 | 0.01 | 1.21 |
|
TB @ MIL | 0.14 | 0.94 | 1.53 | 0.46 | 0.29 | 0.03 | 0.03 | 0.63 |
|
TB @ MIL | 0.12 | 0.73 | 1.23 | 0.39 | 0.37 | 0.10 | 0.04 | 1.00 |
|
TB @ MIL | 0.12 | 0.71 | 1.18 | 0.36 | 0.27 | 0.07 | 0.02 | 1.16 |
|
TB @ MIL | 0.09 | 0.76 | 1.25 | 0.36 | 0.16 | 0.12 | 0.02 | 1.10 |
|
TB @ MIL | 0.14 | 0.66 | 1.24 | 0.39 | 0.27 | 0.02 | 0.02 | 1.01 |

|
TB @ MIL | 0.11 | 0.76 | 1.25 | 0.38 | 0.33 | 0.01 | 0.05 | 0.72 |

|
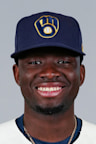
TB @ MIL | 0.10 | 0.77 | 1.21 | 0.38 | 0.26 | – | 0.03 | 0.74 |
|
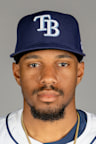
TB @ MIL | 0.09 | 0.72 | 1.17 | 0.36 | 0.23 | – | 0.02 | 0.88 |
|
TB @ MIL | 0.01 | 0.92 | 1.13 | 0.29 | 0.18 | 0.21 | 0.00 | 0.56 |

|
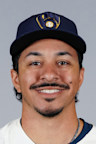
TB @ MIL | 0.05 | 0.56 | 0.86 | 0.26 | 0.32 | 0.12 | 0.01 | 1.06 |
|
TB @ MIL | 0.06 | 0.62 | 0.94 | 0.27 | 0.18 | 0.17 | 0.02 | 0.93 |
Pitchers

|
TB @ MIL | 100.0% | 5.5 | 6.1 | 1.66 | 4.51 | 0.12 | 2.10 | 22.6 |

|
TB @ MIL | 100.0% | 5.6 | 5.9 | 1.41 | 4.21 | 0.11 | 1.78 | 22.3 |

|
TB @ MIL | 85.3% | 0.8 | 0.9 | 0.32 | 0.61 | 0.02 | 0.40 | 3.3 |

|
TB @ MIL | 80.0% | 0.9 | 1.2 | 0.30 | 0.74 | 0.02 | 0.38 | 3.7 |

|
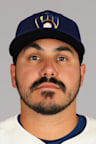
TB @ MIL | 74.4% | 0.9 | 0.9 | 0.48 | 0.70 | 0.03 | 0.45 | 3.8 |
|
TB @ MIL | 72.9% | 0.9 | 0.8 | 0.33 | 0.73 | 0.05 | 0.37 | 3.7 |
|
TB @ MIL | 70.6% | 0.9 | 0.6 | 0.35 | 0.98 | 0.03 | 0.56 | 3.9 |

|
TB @ MIL | 50.4% | 0.9 | 1.0 | 0.34 | 0.72 | 0.02 | 0.44 | 3.8 |
|
TB @ MIL | 39.7% | 0.9 | 1.0 | 0.26 | 0.78 | 0.02 | 0.41 | 3.8 |

|
TB @ MIL | 38.7% | 1.0 | 0.9 | 0.27 | 0.83 | 0.02 | 0.43 | 4.0 |
|
TB @ MIL | 37.3% | 0.9 | 1.0 | 0.36 | 0.75 | 0.02 | 0.37 | 3.8 |

|
TB @ MIL | 35.0% | 0.9 | 1.0 | 0.32 | 0.91 | 0.06 | 0.47 | 4.0 |

|
TB @ MIL | 34.3% | 0.9 | 1.0 | 0.38 | 0.73 | 0.02 | 0.39 | 3.9 |

|
TB @ MIL | 33.2% | 0.9 | 1.1 | 0.44 | 0.86 | 0.05 | 0.51 | 4.2 |

|
TB @ MIL | 30.6% | 0.9 | 1.0 | 0.44 | 0.70 | 0.01 | 0.35 | 4.0 |

|
TB @ MIL | 17.4% | 0.9 | 0.8 | 0.40 | 0.83 | 0.03 | 0.42 | 4.0 |

|
TB @ MIL | 16.4% | 0.9 | 0.8 | 0.45 | 0.90 | 0.04 | 0.52 | 4.1 |
|
TB @ MIL | 11.8% | 0.9 | 0.7 | 0.42 | 0.77 | 0.03 | 0.48 | 3.9 |

|
TB @ MIL | 11.3% | 0.9 | 1.1 | 0.35 | 0.83 | 0.01 | 0.45 | 3.9 |
|
TB @ MIL | 8.3% | 0.9 | 0.9 | 0.52 | 0.87 | 0.01 | 0.52 | 4.2 |

|
TB @ MIL | 3.2% | 0.8 | 1.2 | 0.59 | 0.81 | 0.03 | 0.44 | 3.8 |
Fantasy
Batters
Not yet included: Runs Scored
Estimated, not directly simulated: SB
| 1 | Junior Caminero | TB @ MIL | 6.6 | 1.69 | 0.53 | 0.37 | 0.04 | 0.01 |
| 2 | Jake Bauers | TB @ MIL | 6.1 | 1.39 | 0.40 | 0.50 | 0.09 | 0.03 |
| 3 | Jackson Chourio | TB @ MIL | 6.0 | 1.60 | 0.42 | 0.24 | 0.09 | 0.01 |
| 4 | William Contreras | TB @ MIL | 5.8 | 1.53 | 0.46 | 0.29 | 0.03 | 0.03 |
| 5 | Yandy Díaz | TB @ MIL | 5.8 | 1.60 | 0.38 | 0.31 | 0.01 | 0.04 |
| 6 | Brice Turang | TB @ MIL | 5.7 | 1.27 | 0.33 | 0.46 | 0.13 | 0.01 |
| 7 | Jonathan Aranda | TB @ MIL | 5.5 | 1.38 | 0.37 | 0.41 | 0.01 | 0.05 |
| 8 | Richie Palacios | TB @ MIL | 5.4 | 1.23 | 0.39 | 0.37 | 0.10 | 0.04 |
| 9 | Garrett Mitchell | TB @ MIL | 5.4 | 1.20 | 0.38 | 0.35 | 0.13 | 0.03 |
| 10 | Liam Hicks | TB @ MIL | 5.0 | 1.25 | 0.38 | 0.33 | 0.01 | 0.05 |
| 11 | Jonny Deluca | TB @ MIL | 4.9 | 1.25 | 0.36 | 0.16 | 0.12 | 0.02 |
| 12 | Chandler Simpson | TB @ MIL | 4.8 | 1.13 | 0.29 | 0.18 | 0.21 | 0.00 |
| 13 | Christian Yelich | TB @ MIL | 4.8 | 1.18 | 0.36 | 0.27 | 0.07 | 0.02 |
| 14 | Victor Mesa | TB @ MIL | 4.8 | 1.24 | 0.39 | 0.27 | 0.02 | 0.02 |
| 15 | Cooper Pratt | TB @ MIL | 4.6 | 1.21 | 0.38 | 0.26 | – | 0.03 |
| 16 | Luis Lara | TB @ MIL | 4.4 | 1.17 | 0.36 | 0.23 | – | 0.02 |
| 17 | David Hamilton | TB @ MIL | 4.2 | 0.94 | 0.27 | 0.18 | 0.17 | 0.02 |
| 18 | Taylor Walls | TB @ MIL | 4.1 | 0.86 | 0.26 | 0.32 | 0.12 | 0.01 |
Pitchers
Not yet included: Wins, Losses, Saves
Points are expected points: the line if he pitches, times his chance to pitch.
| 1 | Logan Henderson | TB @ MIL | 21.9 | 5.65 | 5.92 | 1.41 | 4.21 | 0.11 | 1.78 |
| 2 | Drew Rasmussen | TB @ MIL | 20.4 | 5.55 | 6.09 | 1.66 | 4.51 | 0.12 | 2.10 |
| 3 | Ian Seymour | TB @ MIL | 3.0 | 0.90 | 1.18 | 0.30 | 0.74 | 0.02 | 0.38 |
| 4 | Cam Booser | TB @ MIL | 2.4 | 0.81 | 0.95 | 0.32 | 0.61 | 0.02 | 0.40 |
| 5 | Jojo Romero | TB @ MIL | 1.8 | 0.89 | 0.77 | 0.33 | 0.73 | 0.05 | 0.37 |
| 6 | Dl Hall | TB @ MIL | 1.7 | 0.88 | 0.87 | 0.48 | 0.70 | 0.03 | 0.45 |
| 7 | Tyler Wells | TB @ MIL | 1.5 | 0.91 | 1.02 | 0.34 | 0.72 | 0.02 | 0.44 |
| 8 | Kevin Kelly | TB @ MIL | 1.3 | 0.94 | 0.99 | 0.26 | 0.78 | 0.02 | 0.41 |
| 9 | Abner Uribe | TB @ MIL | 1.2 | 0.94 | 0.98 | 0.36 | 0.75 | 0.02 | 0.37 |
| 10 | Trevor Megill | TB @ MIL | 1.1 | 0.98 | 0.92 | 0.27 | 0.83 | 0.02 | 0.43 |
| 11 | Cole Sulser | TB @ MIL | 1.1 | 0.94 | 0.98 | 0.38 | 0.73 | 0.02 | 0.39 |
| 12 | Bryan Baker | TB @ MIL | 1.0 | 0.95 | 1.03 | 0.44 | 0.70 | 0.01 | 0.35 |
| 13 | Kyle Harrison | TB @ MIL | 1.0 | 0.94 | 0.99 | 0.32 | 0.91 | 0.06 | 0.47 |
| 14 | Aaron Ashby | TB @ MIL | 0.9 | 0.95 | 1.06 | 0.44 | 0.86 | 0.05 | 0.51 |
| 15 | Antonio Senzatela | TB @ MIL | 0.8 | 0.90 | 0.64 | 0.35 | 0.98 | 0.03 | 0.56 |
| 16 | Steven Matz | TB @ MIL | 0.4 | 0.95 | 0.80 | 0.40 | 0.83 | 0.03 | 0.42 |
| 17 | Griffin Jax | TB @ MIL | 0.4 | 0.93 | 1.09 | 0.35 | 0.83 | 0.01 | 0.45 |
| 18 | Shane Drohan | TB @ MIL | 0.3 | 0.95 | 0.80 | 0.45 | 0.90 | 0.04 | 0.52 |
| 19 | Dustin May | TB @ MIL | 0.2 | 0.94 | 0.75 | 0.42 | 0.77 | 0.03 | 0.48 |
| 20 | Freddy Peralta | TB @ MIL | 0.2 | 0.93 | 0.92 | 0.52 | 0.87 | 0.01 | 0.52 |
| 21 | Garrett Cleavinger | TB @ MIL | 0.1 | 0.84 | 1.16 | 0.59 | 0.81 | 0.03 | 0.44 |